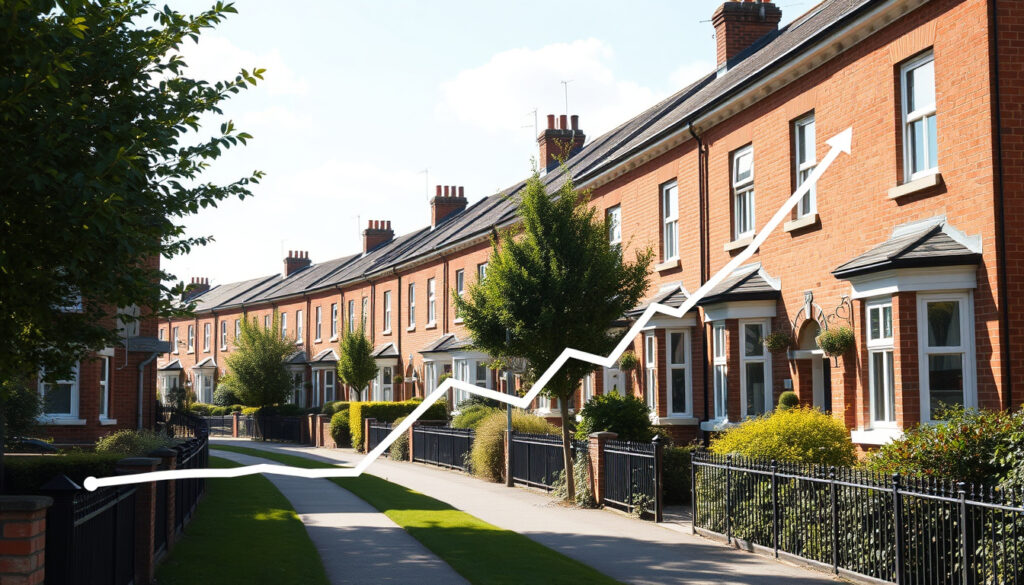
UK House Price Inflation: Latest Data and Analysis
A decade ago, the average UK home cost just under £197,000. Today, that same property sits at nearly £271,000 — yet in real terms, buyers are arguably no better off than they were in 2016. New official data shows that while house prices climbed 37.6% over ten years, everyday inflation ran 40.2% in the same period, meaning the modest “gains” often advertised in property wealth were largely eaten away by the rising cost of everything else. This piece puts the numbers side by side — with regional breakdowns and 2026 forecasts — so you can see exactly where the UK property market stands against its own history.
Annual inflation to Feb 2026: 1.2% · Average house price Feb 2026: £268,000 · Zoopla annual inflation Mar 2026: +1.3% · Housing costs rise past 5 years: 41% · ONS provisional growth to Feb 2026: 1.2%
Quick snapshot
- House prices rose 37.6% over 10 years, but CPI inflation hit 40.2% in the same window (Chartwell Financial Services)
- Average UK house price reached £270,873 in January 2026 (Chartwell Financial Services)
- CPIH inflation stood at 3.4% in March 2026, up from 3.2% in February (Office for National Statistics)
- Whether Capital Economics’ optimistic 3.5% Q4 2026 forecast will hold if inflation rebounds
- Exact regional spread across all 300+ local authority areas over the decade
- How mortgage rate volatility will reshape demand in the second half of 2026
- 2016–2026: modest nominal growth, meaningful real-terms shortfall vs CPI
- 2022–2023: seven months of double-digit inflation reshaped affordability
- 2025–2029: Savills and OBR project 2–2.5% annual growth through decade’s end
- Capital Economics projects 3.5% growth by Q4 2026, above the 2.5–2.8% consensus (Capital Economics)
- Savills forecasts cumulative 25% growth by 2030 on average UK property (Audit Consulting Group)
- OBR expects average prices to near £305,000 by 2030 from roughly £260,000 in 2024 (Fairstone)
The table below consolidates the key figures from official sources and leading analysts.
| Metric | Value | Period |
|---|---|---|
| Latest annual inflation | 1.2% | Feb 2026 |
| Average price | £268,000 | Feb 2026 |
| Zoopla rate | +1.3% | Mar 2026 |
| 5-year cost rise | 41% | Past 5 years |
| House price 10-year gain | 37.6% | Jan 2016–Jan 2026 |
| CPI 10-year gain | 40.2% | Jan 2016–Jan 2026 |
| Regional high | +3.9% | Yorkshire, Feb 2026 |
| Regional low | −3.3% | London, Feb 2026 |
| Consensus 2026 forecast | 2.5–2.8% | Full year |
| Capital Economics 2026 | 3.5% | Q4 2026 |
| Savills 2030 target | ~25% | Cumulative |
| OBR 2030 target | £305,000 | Average price |
Do UK house prices keep up with inflation?
The honest answer, backed by a decade of data, is: barely, and sometimes not at all. According to Chartwell Financial Services — which tracks Nationwide Building Society records back to 1995 — the average UK house price sat at £196,829 in January 2016. By January 2026, it had climbed to £270,873. That sounds like a 37.6% windfall for anyone who bought a decade ago.
But CPI inflation tells a harsher story. Consumer prices rose 40.2% over exactly the same period, meaning the real purchasing power of that property wealth actually shrank. The gap widened further in the three years leading up to January 2026: average house prices added just 4.9% while CPI piled on 10.4% more. For homeowners who assumed their property was a reliable inflation hedge, the numbers are quietly uncomfortable.
“The data shows that house price growth has consistently lagged behind general inflation over the past decade, which fundamentally challenges the assumption that property always outperforms.”
— Chartwell Financial Services
Historical comparison
Looking further back, the long-run UK house price chart tells a familiar tale of nominal peaks masking real-terms stagnation. As House Price Inflation notes, since 2020 prices surged nominally on supply shortages and pandemic-driven demand — but adjusting for CPI shows much of that spike was wiped out by the sharp inflation surge of 2022–2023.
Between September 2022 and March 2023, the UK experienced seven months of double-digit inflation, peaking at 11.1% in October 2022 (Statista). Property prices never kept pace with that pace of erosion, even with mortgage rates climbing to 15-year highs.
Recent trends
The most recent ONS figures show CPIH inflation — the ONS’s preferred measure including owner-occupiers’ housing costs — at 3.4% in the 12 months to March 2026, up from 3.2% in February (Office for National Statistics). That OOH component accounts for roughly 18% of the CPIH basket, making it a structural driver of why CPIH typically runs above plain CPI. Pure CPI came in at 3.3% for the same period, according to the ONS bulletin.
How much have UK house prices risen in the last 10 years?
On paper, the headline figure is a 37.6% jump from £196,829 to £270,873 across the decade. But that national average conceals dramatic regional divergences. The story of UK property over ten years is really several stories told simultaneously across postcode clusters that barely recognise each other.
National average increase
Nationwide Building Society data (via Chartwell Financial Services) confirms the 37.6% nominal rise. However, when you strip out 40.2% CPI inflation, the real-terms return on a median UK home over ten years is effectively negative. Put another way: a homeowner who sold in January 2026 and immediately bought an equivalent property would have needed to find extra cash — the house had cost more in real terms than it had gained in value.
The contrast is even sharper when viewed through the lens of housing-specific costs. According to Statista, the Consumer Price Index for housing, water and fuels stood at 149.6 in Q1 2026, having grown 41% since 2015 — outpacing overall CPI growth of 35.2%. Owning and maintaining property has literally become more expensive faster than the asset itself appreciates.
“The north-south divide in house price growth in England is likely to persist, with higher growth in the north than in the south as affordability pressures moderate demand in the southeast.”
— Paula Higgins, HomeOwners Alliance
Regional variations
MoneyWeek’s roundup of February 2026 Land Registry data shows how unevenly the decade’s gains were distributed:
The regional breakdown reveals significant disparities across the UK, with growth ranging from strongly positive in some areas to negative in others.
| Region | Annual growth to Feb 2026 | Average price |
|---|---|---|
| Yorkshire and the Humber | +3.9% | — |
| Wales | +2.5% | £210,000 |
| England (12-month) | +0.8% | £290,000 |
| Scotland (Nationwide, Mar 2026) | +3.0% | £191,747 |
| London | −3.3% | — |
London stands out as the clearest outlier — and the one region where ten-year property “wealth” for existing owners has genuinely struggled. The capital’s -3.3% annual decline contrasts sharply with the 3.9% growth in Yorkshire, and that gap has widened steadily since London’s 2022 peaks. Meanwhile, Paula Higgins of the HomeOwners Alliance expects the north-south divide in England to persist, with higher growth in northern regions as affordability pressures moderate demand in the southeast.
What is the UK property forecast for the next 5 years?
Multiple forecasters have published five-year outlooks for UK house prices, and their estimates converge — but not completely. The range reflects genuine uncertainty about mortgage rates, supply, and whether inflation stays tamed or rebounds.
Savills forecasts 2025–2029
Savills, one of the UK’s largest estate agency groups, projects UK house prices to grow by roughly 2% in 2026 and nearly 25% cumulatively by 2030, according to analysis compiled by Audit Consulting Group. That cumulative figure — averaging just under 4.5% per year across four years — places Savills slightly above the consensus but within a plausible band.
The Savills view leans on the assumption that mortgage rates continue their gradual descent, wage growth holds above price growth, and new housing supply remains constrained in the south of England where demand pressure is highest.
Yopa 2026 tracker and revised mainstream forecasts
Nationwide’s House Price Review, summarised by MoneyWeek, pencilled in a 2–4% UK property price rise for 2026, citing falling mortgage rates and wage growth outpacing property price growth. Pantheon Macroeconomics, however, took a more cautious line — adjusting their 2026 growth forecast downward from 3% to 1% — reflecting concern that the improvement in affordability may not translate into transactions volume.
The Reuters poll of housing analysts in March 2026 placed the consensus at 2.5% property price growth for 2026, down from 2.8% in December 2025. That marginal softening reflects the gap between aspiration and spending power: buyers can see lower rates, but they still face stretched loan-to-income multiples that limit how much they can borrow.
Will UK house prices fall in 2026?
The majority view says no — but the margin of confidence is thin, and the downside scenarios are more live than headline forecasts suggest. The question isn’t really whether prices fall off a cliff; it’s whether they fail to grow fast enough to stay ahead of inflation, mortgage stress, and economic uncertainty.
Risk factors
Capital Economics — the most optimistic voice in recent forecasting rounds — attributes its 3.5% Q4 2026 growth projection to four tailwinds: lower inflation, lower interest rates, tight supply of new homes, and the prospect of more high loan-to-income mortgage lending (Capital Economics). That figure exceeds the consensus forecast of 2.5–2.8% by a meaningful margin.
The risk factors that could push prices lower include: a renewed inflation spike forcing the Bank of England to hold or raise rates; job losses in sectors exposed to public spending restraint; and mortgage rate volatility if gilt yields react sharply to fiscal events. None of these are base-case scenarios, but they are not tail risks either.
Expert predictions
Paula Higgins of the HomeOwners Alliance puts the figure at “around 2% higher in 2026” — modest growth that barely moves the needle against a 2.3% inflation baseline. Her view is grounded in what she calls the “affordability ceiling”: buyers can only borrow so much relative to their incomes, and that ceiling hasn’t risen meaningfully despite rate reductions.
The OBR’s own projection, as cited in Fairstone’s Spring Forecast 2026 summary, expects house price inflation to average just over 2.5% for the remainder of its forecast period — essentially tracking income growth rather than outrunning it. The OBR sees average prices rising from roughly £260,000 in 2024 to just under £305,000 by 2030.
UK House Prices vs. Inflation: A 10-Year Reality Check
Strip away the estate agent brochures, and the data tells a story that challenges one of the most persistent myths of British personal finance: that property is an automatic wealth creator that reliably beats inflation over time. The decade from 2016 to 2026 is a case study in why that assumption needs qualification.
Graph trends 10–50 years
Nationwide’s long-run dataset, tracked by Cladco, shows UK average house prices rising from £1,884 in 1953 to £272,378 in Q4 2025 — an extraordinary nominal increase over 70 years. But every serious analysis of this series acknowledges that nominal prices tell only part of the story. Adjusted for general inflation, the real-terms gains over the full 70-year arc look considerably more modest.
What the 10-year window specifically reveals is that the post-pandemic surge — when average UK prices spiked on pandemic-fuelled demand and government support — has since been partially unwound by the combination of rising mortgage rates and inflation eroding purchasing power. The headline peaks of 2022 have not returned in real terms, and the current market appears to be in a period of consolidation rather than renewed acceleration.
Inflation calculators and real-terms equivalents
For readers who want to model their own position, the key calculation is straightforward: take any house price figure and deflate it by cumulative CPI. A home bought for £196,829 in January 2016 would need to sell for approximately £276,258 in January 2026 just to break even in real terms. Selling at £270,873 — the actual January 2026 average — means a real-terms loss of around £5,400 on a decade-old asset, before transaction costs, maintenance, and mortgage interest.
The pattern: nominal growth masks real-terms stagnation when general inflation runs hotter than asset appreciation — a dynamic that catches out homeowners who budgeted based on headline price gains.
The gap between CPI and house price growth isn’t just academic — it directly affects mortgage affordability calculations, equity release decisions, and inheritance planning. If CPI holds at 2.3–3.4% while house prices grow at 2.5%, existing homeowners may feel wealthier on paper but remain no better off in real terms.
For first-time buyers in 2026, the inflation-adjusted view is a sobering one: they are buying at near-record prices, funded by mortgages carrying rates that, while lower than 2023 peaks, still significantly exceed the 1.2% annual house price inflation being recorded. Their real-terms acquisition cost is being set against a market that is barely growing in nominal terms, let alone real ones.
Related reading: NS&I Savings Rates · Halifax Bank
Recent Zoopla sold house prices data underpins the regional growth patterns and aligns closely with Savills’ 5-year forecasts for UK property inflation.
Frequently asked questions
What is the current UK house price inflation rate?
The latest official provisional figure shows annual house price inflation of 1.2% in the 12 months to February 2026, according to ONS data. Zoopla’s own index recorded a slightly higher rate of +1.3% for the year to March 2026, reflecting differences in methodology and data sources. Both figures are well below the 3.3–3.4% headline CPI/CPIH inflation running at the same time.
How does UK house price inflation compare to CPI?
Over the past decade, CPI has outpaced house price growth by approximately 2.6 percentage points: 40.2% cumulative CPI inflation versus 37.6% house price growth from January 2016 to January 2026. In practical terms, this means homeowners who held property for the full decade are worse off in real terms than if they had held cash in a savings account tracking inflation. The divergence was most acute between 2022 and 2023, when CPI hit 11.1% while property prices stagnated.
What factors affect UK house price inflation?
Five structural forces drive UK house price inflation: mortgage interest rates (which set borrowing costs), housing supply (new build volumes versus demand), wage growth (which determines what buyers can afford), general inflation (which erodes real returns and influences BoE policy), and regional economic migration (London versus northern regions). Each interacts with the others — tight supply alongside rising rates can cap growth even as wages climb.
What is UK house price inflation over the last 50 years?
Over 70 years, the average UK house price has risen from £1,884 in 1953 to £272,378 in Q4 2025 — a nominal increase of roughly 14,400%. However, adjusting for general inflation dramatically reduces the real-terms gain. The key insight is that most of the real-terms appreciation happened in specific decades (1970s oil shocks aside, the 2000s and early 2010s saw the strongest inflation-adjusted growth), while others — particularly the 2010s and the post-2022 correction — delivered little or negative real returns.
How has UK house price inflation trended in 2023?
2023 was a year of partial normalisation after the double-digit inflation peaks of late 2022. CPI fell from 9.1% in 2022 to 7.3% in 2023, while house prices struggled to keep pace — the real-terms gap between the two continued to widen in favour of neither party. The housing market effectively froze in the first half of 2023 as mortgage rates spiked above 6%, before easing modestly in Q4 as the Bank of England held rates.
What drives regional UK house price differences?
Affordability constraints, employment concentration, and housing supply respond differently across regions. London, where average prices exceed £500,000 and mortgage multiples stretch to 10×+ income, has seen consistent underperformance since 2022. Yorkshire and the Humber, by contrast, with lower entry prices and relatively resilient manufacturing and logistics employment, has posted the strongest regional growth at 3.9% to February 2026. The north-south divide — predicted by HomeOwners Alliance CEO Paula Higgins — appears structural rather than cyclical.
Is there a UK house price inflation calculator?
Several tools exist online, including the Bank of England’s own house price calculator and third-party calculators that deflate nominal prices by CPI. The most direct approach is to take a purchase price, apply the cumulative CPI inflation figure from the relevant start and end dates, and compare the result to the current market value. The gap — positive or negative — tells you the real-terms return on the property investment.
What are the best times to sell amid inflation?
For sellers, the optimal window historically coincides with low mortgage rates and rising sentiment — typically spring in the UK, when the market is most active. However, in a high-inflation environment, waiting for a better price means your sale proceeds are eroding in real terms while you hold. The trade-off is between maximise-the-price and minimise-holding-time. Given current forecasts of modest 2–3% annual growth, selling faster and accepting near-market prices may outperform waiting for a peak that may not arrive.
More related posts
 Pottery Barn UK: Can You Buy It? Shipping & IKEA Comparison
 Marty McFly: Facts About the Character and Actor’s Health
 How to Set Out of Office in Outlook: Desktop, Web, Mobile
 Aston Villa vs Chelsea: Head-to-Head, Prediction & Live Updates
 Ipswich Town vs Charlton – Kick-Off Time, Preview & Prediction
 I Jack Wright Cast – Full List, Characters and Crew
 Take Care of Maya: $213M Verdict Overturned in 2025
 Rugby Autumn Internationals 2025 – Fixtures, Results, Schedule